Your Weekly Property Statistics from Regal Estates
Keep a Close Eye on the Property Market with Regal Estates
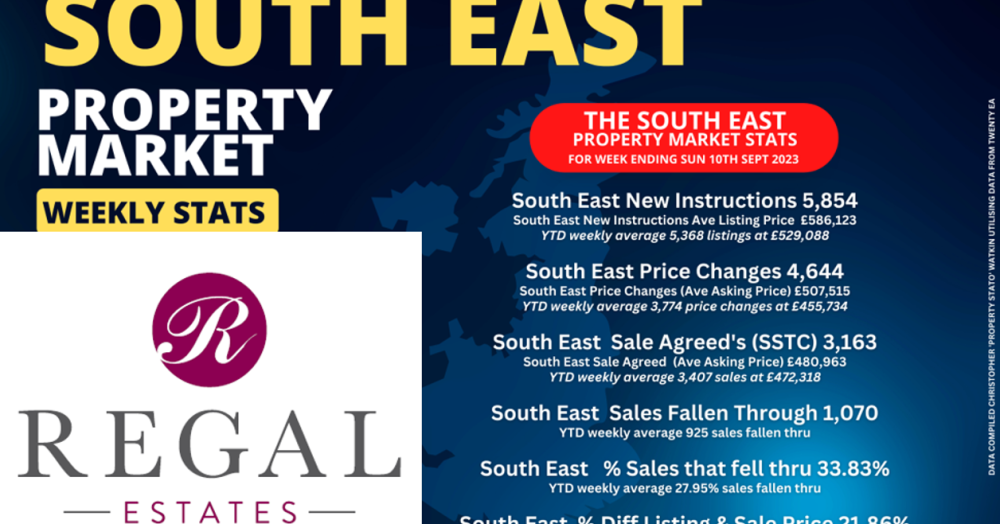
UK Property Market Weekly Report - Week ending Sunday, 10th September 2023
Despite the economic challenges and headwinds of the economy, the British property market bounced back from its usual August Bank Holiday dip with vigour regarding listings and sales.
In a nutshell, the UK Property Market YTD is running at 90.5% of the 2017/8/9 average regarding net sales.
These are the key statistics
· New Properties to the Market (Listings): The number of listings bounced back from last weeks 26,778 to 34,006. The 2023 YTD running weekly average stands strong at 32,651.
· Average Listing Price: The average listing price jumped significantly for the second week to £472,907. The 2023 running weekly average of £431,311.
· Price Reductions: A total of 24,315 price reductions were seen last week, a big jump from last week’s 17,740 (probably because many estate agents were on holiday the week before). The 2023 running weekly average is 19,702.
· Average Asking Price of Properties Being Reduced: This week's average asking price of properties being reduced jumped almost £15k to £429,004. The 2023 running weekly average of £402,325.
· Number of Properties Sold (Gross Sales): Gross sales jumped 18.6% from last weeks Gross sales figures (although they had dropped by 14.7% from the week before that). Total number of gross sales in the UK last week was 20,271. For comparison, the 2023 running weekly average is 21,874 sales (stc) per week.
· Average Asking Price of Properties Sold STC this Week: The average asking price of the properties selling last week was £357,270. The 2023 running weekly average of £358,069.
· Sale Fall Throughs: Sale Fall Thrus jumped up slightly last week to a 29.69% sale fall thru rate (Sale fall Thru Rate % are the number Sale fall Thrus for the week expressed as a percentage of Gross Sales for the week). The 2023 running weekly average is 25.43% (although don’t forget in Q4 2022 the average was North of 38%). 7 year long term average is 24.3%.
· Net Sales This Week: Net Sales jumped by 17.35% from the week before to 14,252 (although don’t forget they did drop 14.6% the week before that because of the August Bank Holiday). The 2023 running weekly average is 16,455.
· Net Sales Year-to-Date : Despite the challenges, the year-to-date net sales of 592k showcase despite the tough economic news, the market is only 9.5% behind the 2017/8/9 average YTD for net sales
Thinking of selling ? Give us a call now at Regal Estates
01227 763888 - Canterbury
01304 611227 - Sandwich
Click here for our property valuation options
