Exploring Canterbury's Property Market Through an Innovative Heat Map
Innovative Property Insights from Regal Estates
In the realm of the property, a fresh perspective can often unveil hidden insights.
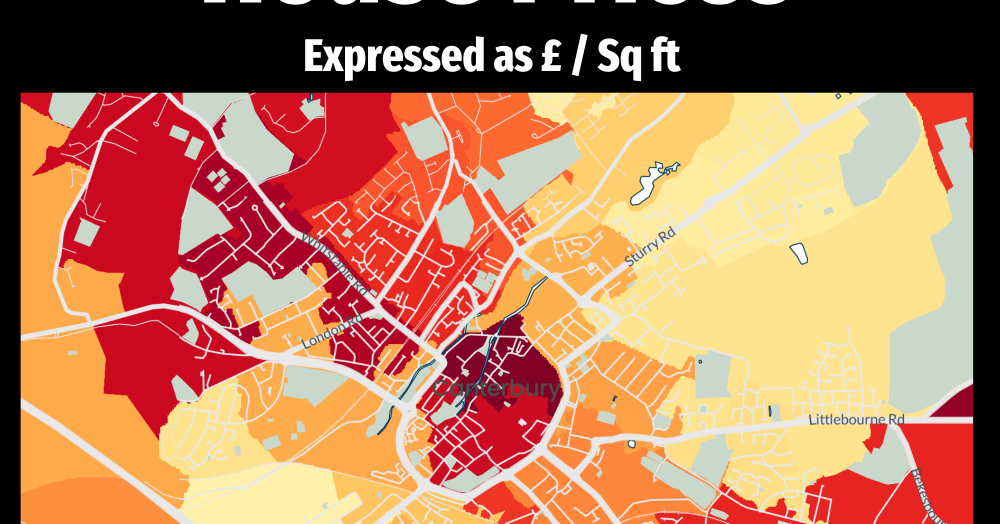
We would like to introduce a distinctive approach to mapping house prices with a heat map that colour-codes Canterbury's property values by £ per square foot.
The map shown below vividly illustrates the varying values across different pockets of the town.
This innovative cartographic tool transcends traditional trends and figures.
It provides Canterbury homeowners, potential buyers, and buy-to-let investors with an enlightened view of property pricing dynamics.
Delving into the nuances of this heat map reveals trends that might otherwise go unnoticed, making it an invaluable asset for decision-making.
If you would like more insight on our local property market, contact me/us agency to gain access to insightful weekly articles and expert commentary, enriching your understanding of Grantham's dynamic property market.
Don't miss out on this opportunity to navigate our local property market armed with cutting-edge insights.

Thinking of selling or letting ?
Give us a call now at Regal Estates
01227 763888 - Canterbury
01304 611227 - Sandwich
Click here for our property valuation options
