Explore the Heart of Canterbury’s Rental Landscape!
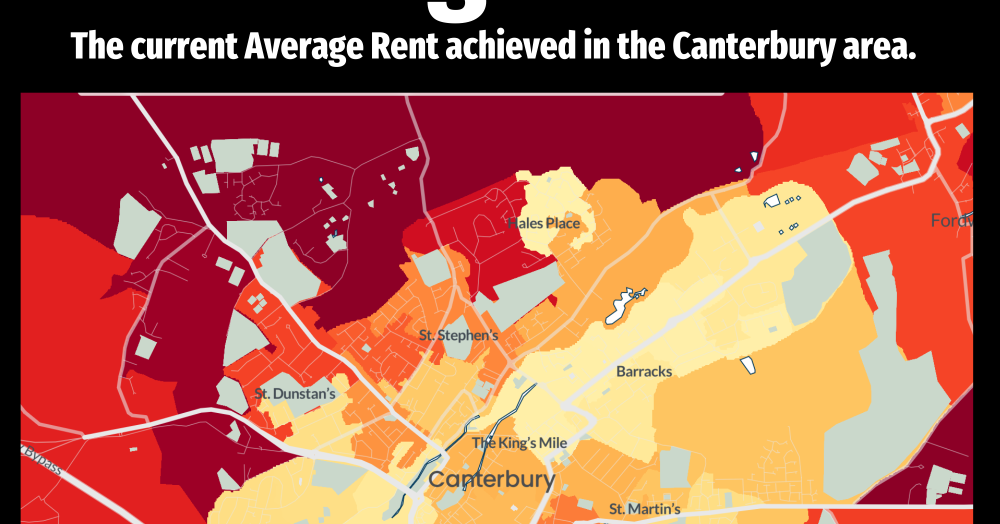
Attention landlords, tenants, and homeowners in Canterbury! 🏡🔍 Dive into the detailed heat map we've crafted showcasing the city's average rents, area by area.
This valuable tool provides a comprehensive overview of rental trends, helping landlords set competitive rates, tenants find the perfect spot, and homeowners understand their local market.
Whether you're curious about investment opportunities, seeking a new rental, or intrigued by your property's potential, this map is a goldmine of insights.
Click on the map to ENLARGE and explore each area's nuances. From up-and-coming neighbourhoods to established favourites, I'm here to guide you through Canterbury's dynamic property landscape.
Trust the leader in Canterbury property to be your guide.
Let's navigate this map together!

01227 767200 - Canterbury
01304 611227 - Sandwich
Click here for our rental valuation options
